
Readings and Visual Media
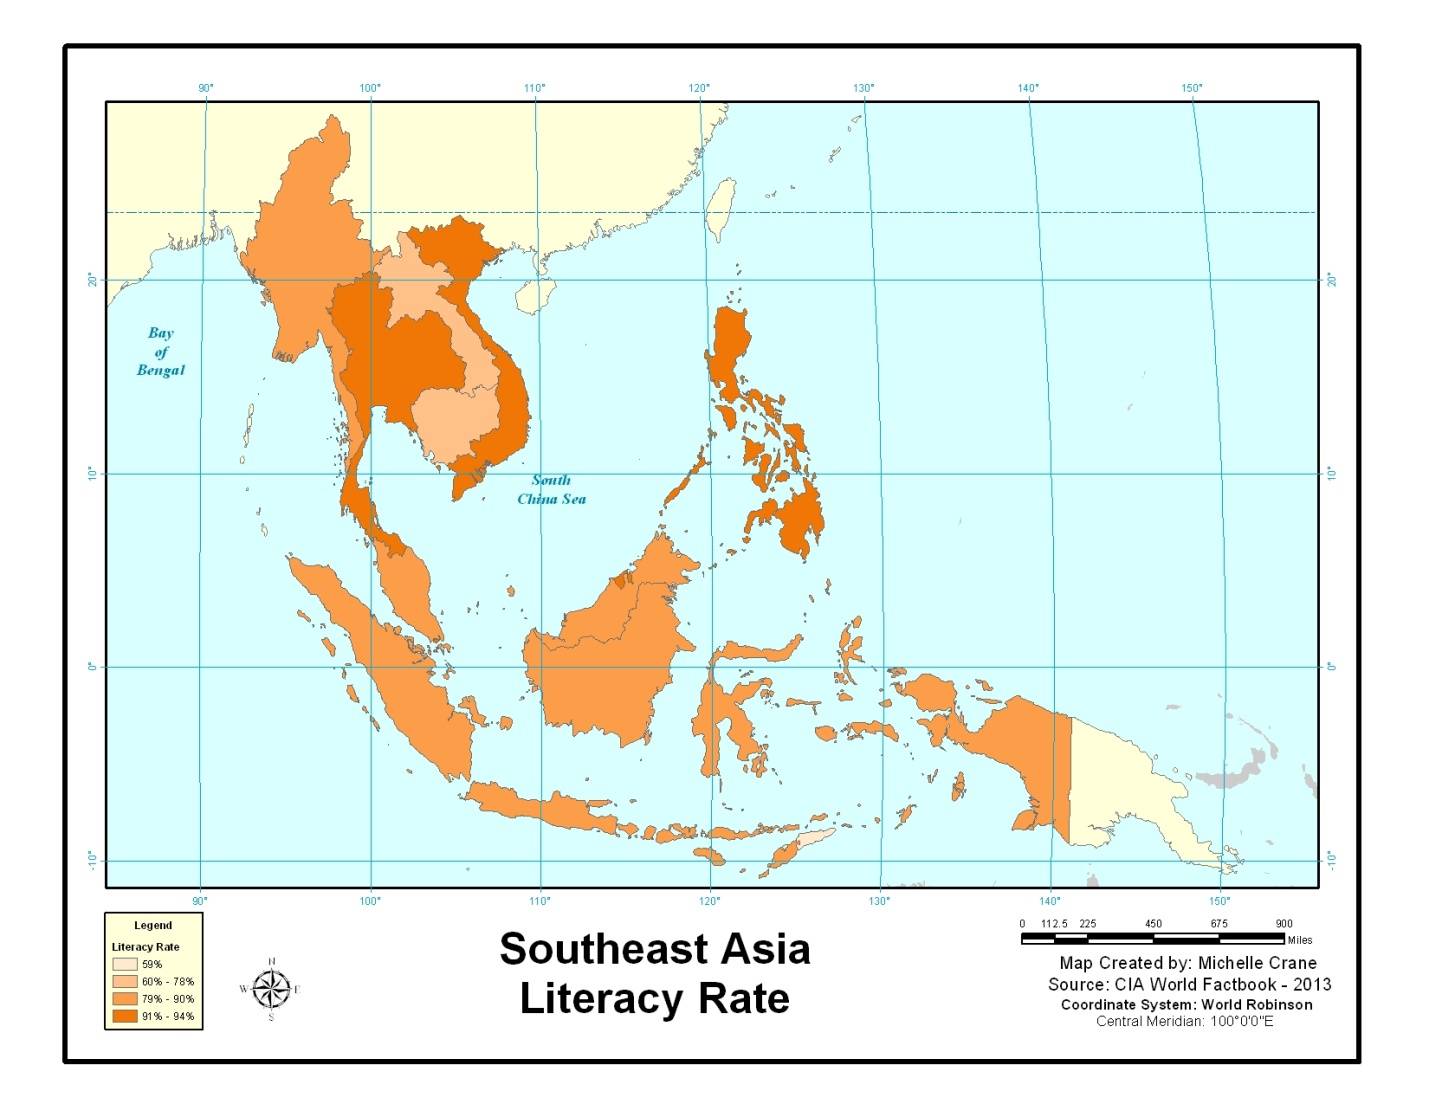
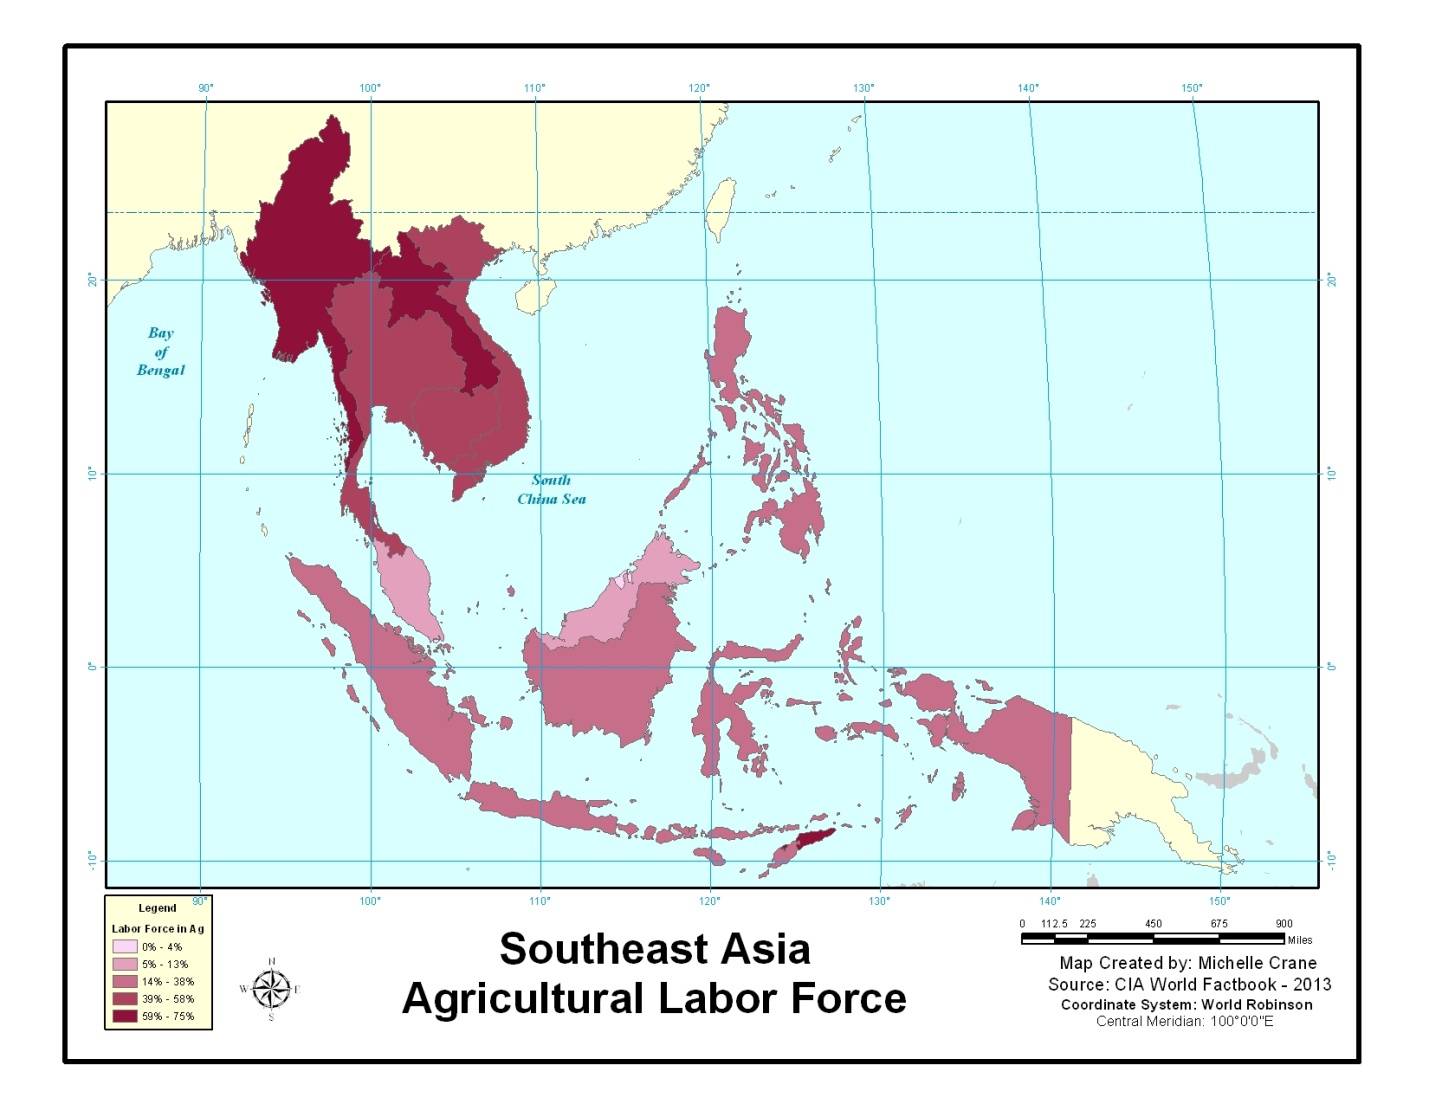
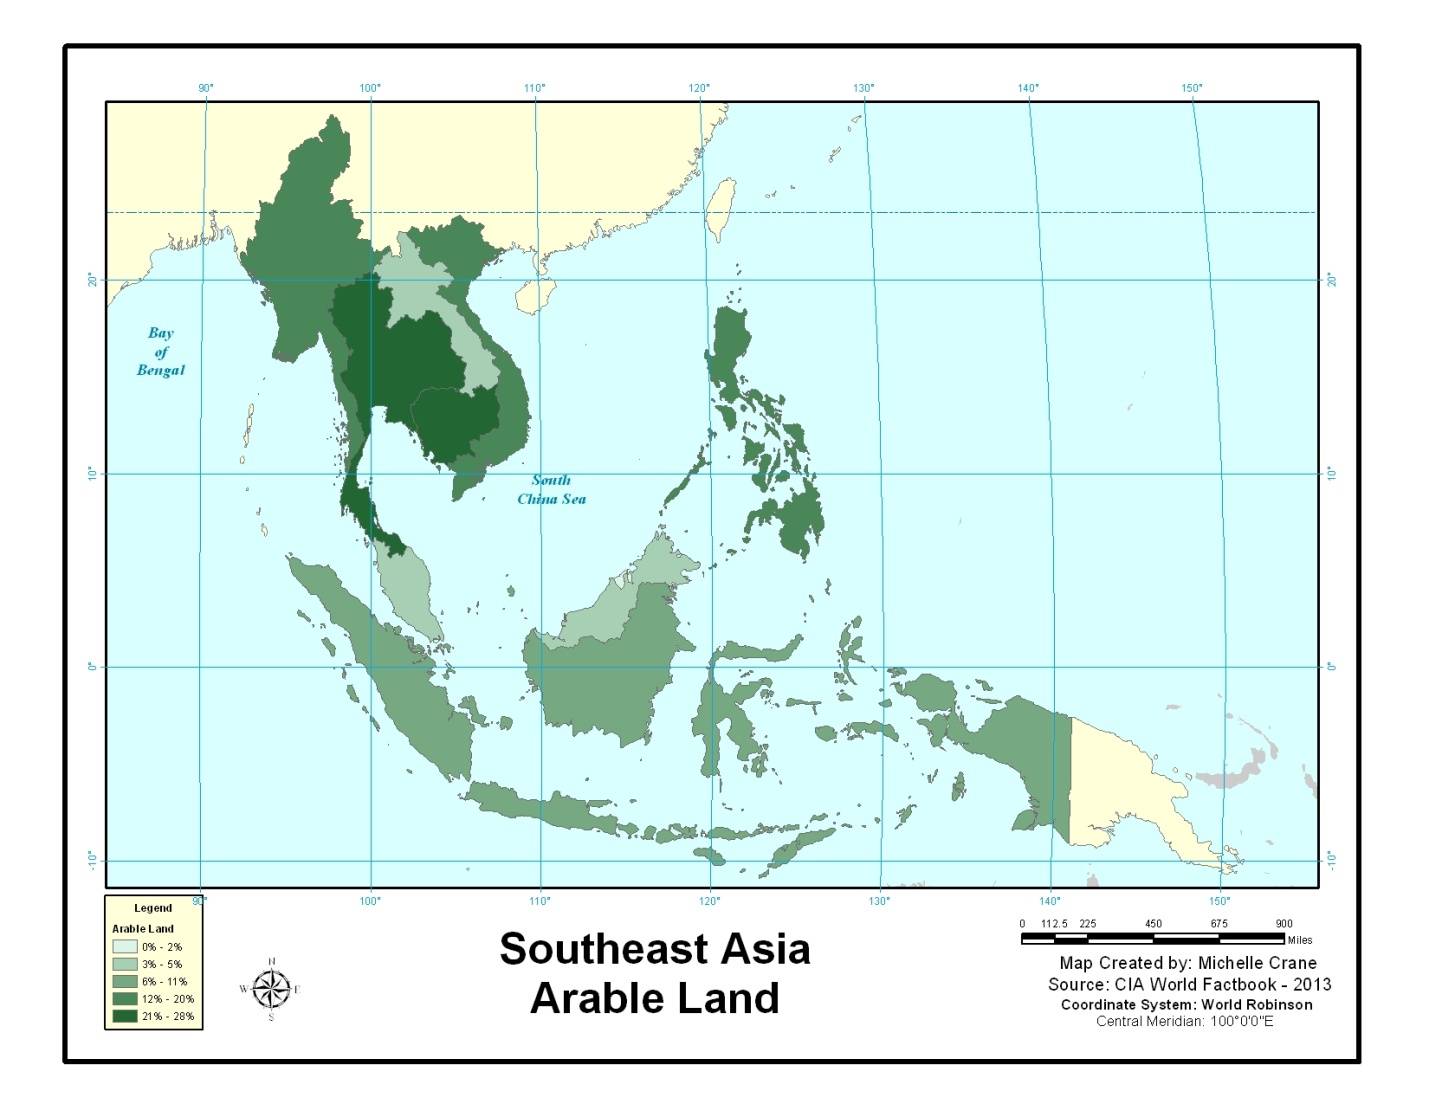
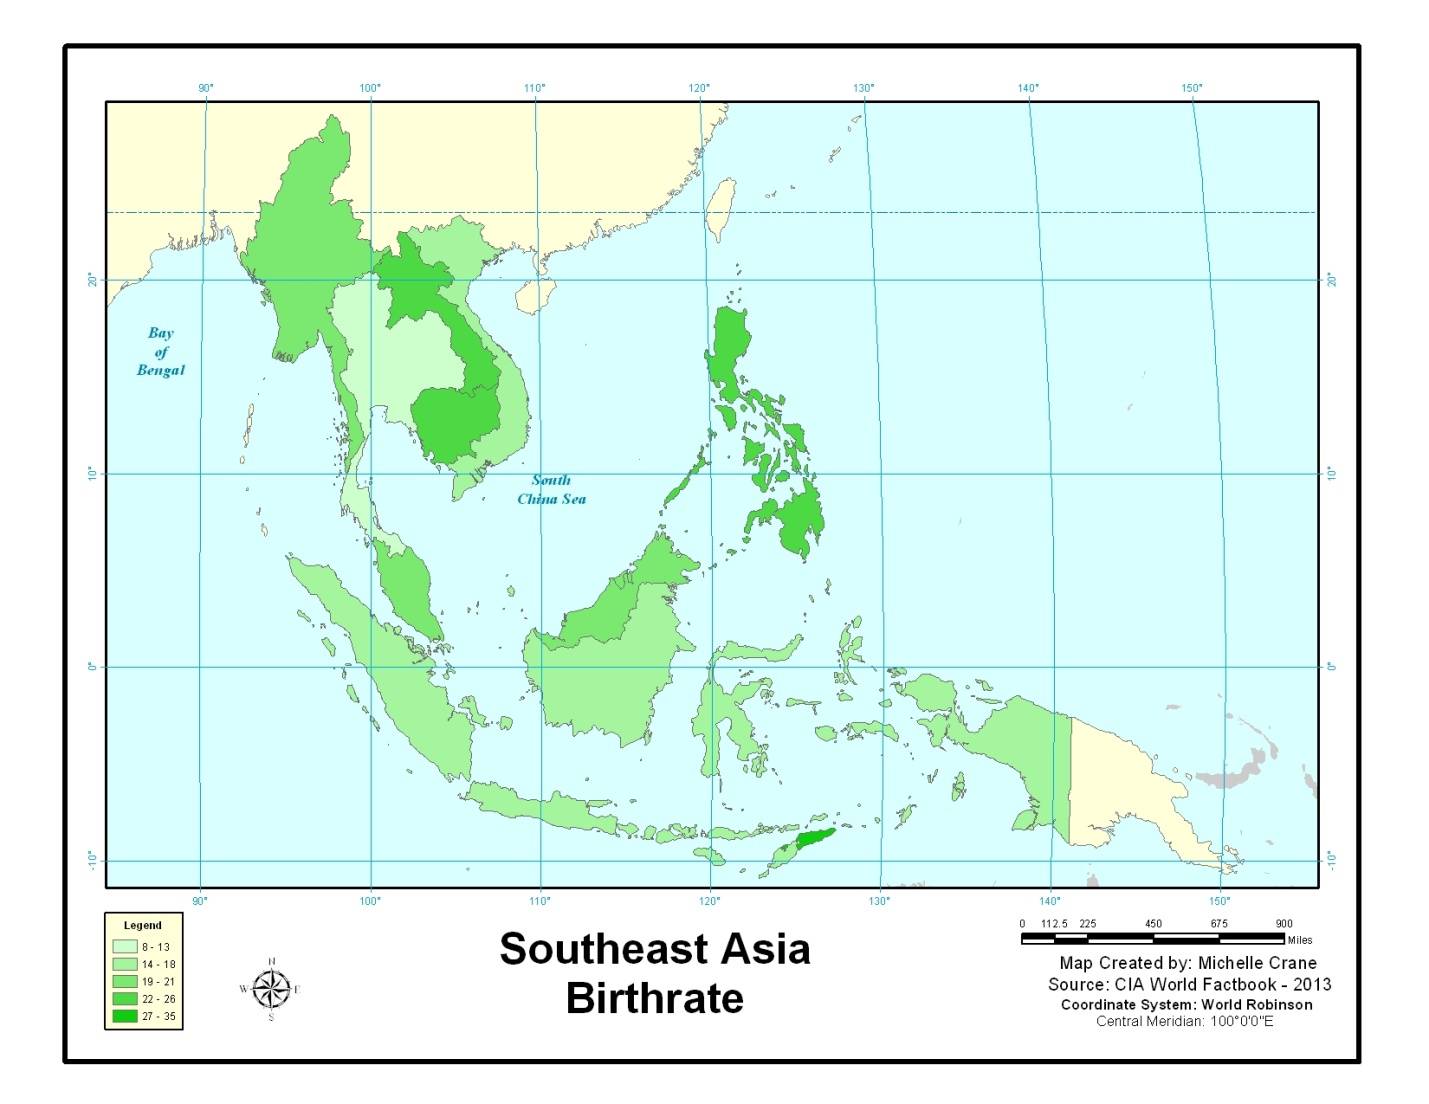
Graphics for the following topics were created using data and images from the CIA World Factbook. https://www.cia.gov/library/publications/the-world-factbook/
Click on each link to open and download the graphic.
WDR 2009: Seeing Development in 3D: Density, Distance, and Division
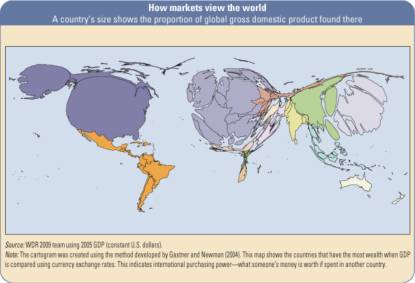
The World Bank prepares several region-specific reports related to economic geography. This map comes from "Geography in Motion: The Report at a Glance - Density, Distance, Division" and it resizes the area of a country to be proportional to 2005 GDP. More available at The World Bank's World Development Reports site:
http://wdronline.worldbank.org/worldbank/a/c.html/world_development_report_2009/
geography_motion_amp_x2014_report_glance_density_distance_division/page/1
Developing Region Growth Comparisons
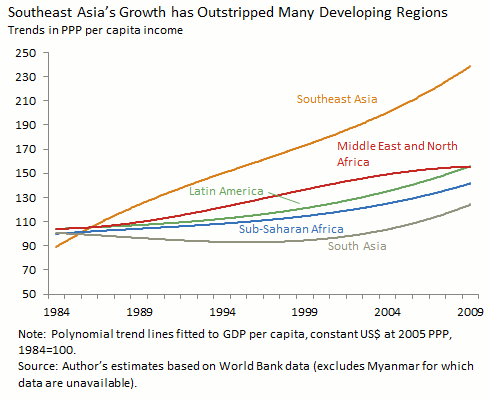
The Carnegie Endowment for International Peace offers an explanation for Southeast Asia's phenomenal growth relative to other developing regions such as Sub-Sharan Africa and Latin America.
http://carnegieendowment.org/ieb/2011/07/07/southeast-asia-crouching-tiger-or-hidden-dragon/8ksb
Perry-Castaneda Library Map Collection: Asia Maps
An extensive collection of maps from the University of Texas at Austin that includes historical, thematic, topographic, and general reference maps from all over Asia.